Trace |
During use of the products, a continuous stream of relevant trace messages is being sent to the trace listeners. On Microsoft Windows, you can use the Microsoft program 'dbgview.exe' to see the trace messages.
Trace options are only available when the environment variable 'INVANTIVE_TRACE_ACTIVE' is set to any non-empty value.
The trace messages are also stored in trace files when the environment variable 'INVANTIVE_TRACE_TO_FILE' is set to 'true'.
The trace messages are also sent to the stderr when the environment variable 'INVANTIVE_TRACE_STDERR' is set to 'true'.
PSQL compilation is also logged when additionally the environment variable 'INVANTIVE_TRACE_PSQL' is set to 'true'.
The default location of the trace files is the folder for temporary files on interactive and OS-applications. The default location for web applications is 'App_Data\Trace'. An alternative folder for trace files can be specified by setting the environment variable 'INVANTIVE_TRACE_FOLDER'.
The default number of seconds after which trace files in the trace folder structure are purged is 7 days. This can be altered by setting the environment variable 'INVANTIVE_TRACE_DELETE_AGE_SEC'. Only files in the configured trace folder are studied for purge; when the trace folder location is changed the software does not study files in the previous locations.
A limited amount of information is sent to the trace when an error occurs. The call stack and the natural key can be sent to trace by setting the environment variable 'INVANTIVE_TRACE_OWN_EXCEPTION_DETAILS' to 'true'.
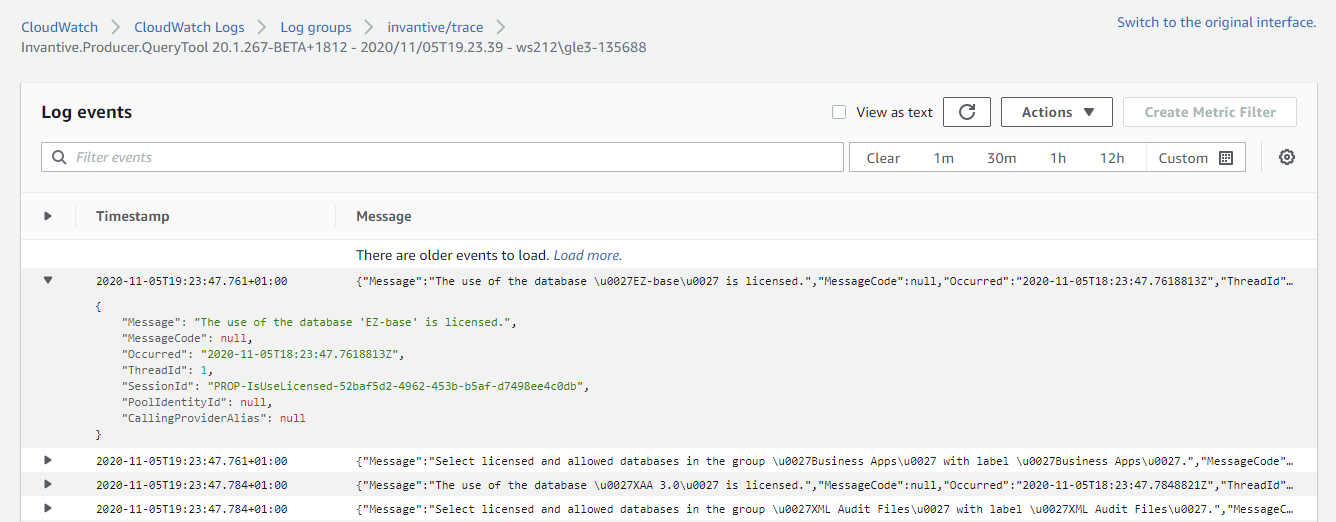
Log to Amazon CloudWatch
The trace can be logged to Amazon CloudWatch by configuring the following environment variables:
•INVANTIVE_TRACE_TO_CLOUDWATCH: change to True to activate logging to CloudWatch
•INVANTIVE_TRACE_CLOUDWATCH_ACCESS_KEY: the access key as generated on Amazon.
•INVANTIVE_TRACE_CLOUDWATCH_SECRET_KEY: the corresponding secret key.
•INVANTIVE_TRACE_CLOUDWATCH_REGION: the geographical region to log the messages.
•INVANTIVE_TRACE_CLOUDWATCH_GROUP: the log group to use for logging.
The identity associated with the access key must allow logging to CloudWatch.
Amazon CloudWatch logging is rate limited. Messages may not be logged during periods of intensive activity.
The log format is JSON-based as shown:
Microsoft Power BI
When used in combination with Microsoft Power BI, please note that Power BI tries to disable all trace logging by third party drivers. Invantive UniversalSQL has limited tracing available through Power BI. To activate: in Power BI go to 'Options and Settings' , then 'Options' and choose 'Diagnostics' in the Global group. Place a checkmark next to 'Enable tracing'. This setting will remain effective till you restart Microsoft Power BI.
Direct Trace
Trace messages generated by Invantive can also be logged to file outside the Microsoft .NET trace mechanism. This is called "direct trace".
The advantages of direct trace are:
•Direct trace starts very early in program execution, even before the normal trace mechanism is activates. It therefore allows analysis of start-up problems.
•Direct trace works independent of the normal trace mechanism. It is therefore available even when the environment manages Microsoft .NET trace, such as with Power BI.
The disadvantages of direct trace are:
•The use of direct trace reduces performance significantly. Therefore only enable direct trace when needed.
To activate direct trace, please set the environment variable 'INVANTIVE_DIRECT_TRACE_FILE_PATH' to the file path of the intended log file.
It is recommended to include the placeholder '{PID}' in the file name when you expect to run multiple OS-processes with direct trace.
A commonly used setting for INVANTIVE_DIRECT_TRACE_FILE_PATH is c:\temp\invantive-direct-trace-{PID}.log.
Mac OSX and Linux
Set the environment variable COMPlus_DebugWriteToStdErr to write trace messages to the console of Microsoft .NET Core applications:
export COMPlus_DebugWriteToStdErr=1
Note that the Microsoft .NET Core implementation on Mac OSX and Linux are restrained in the default stack size. On StackOverflowException such as with Exact Online, please increase stacksize first using:
export COMPlus_DefaultStackSize=10000000