Grid |
The lower part of the screens with tabs of ${products.ie} ${products.ola} will show the search results which comply with the search filter.
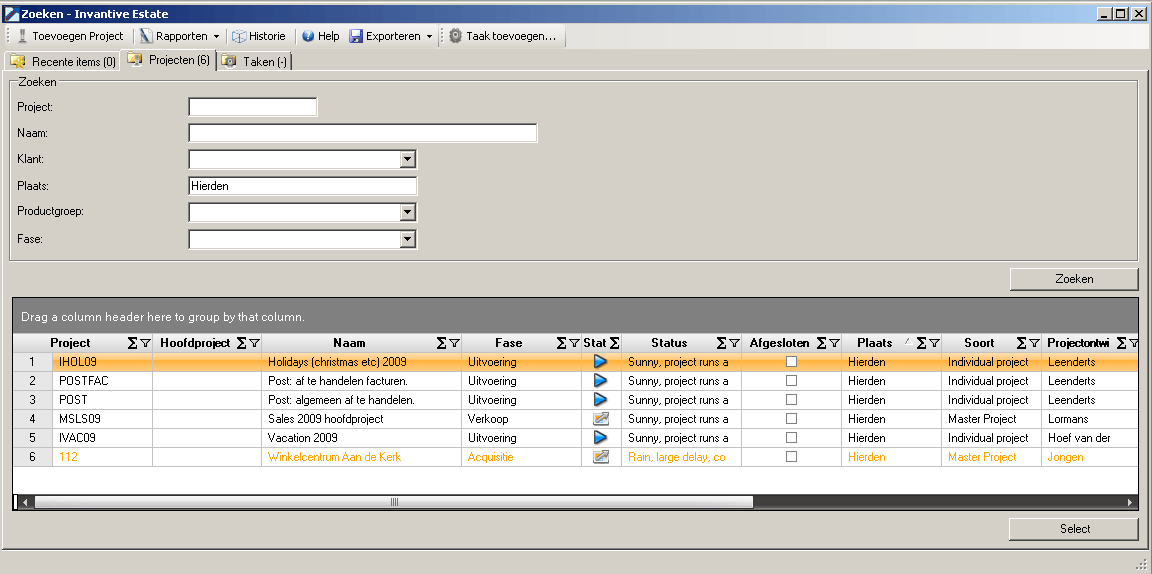
Sort
Above the search results are the column heads which you can use to sort the search results. By clicking on a column head, the selection is sorted on the values in the selected column. If you click on the column header once more, the sorting will happen in the reverse order (descending instead of ascending). An arrow after the column name indicates whether the column is sorted ascending (arrow pointing up) or descending (arrow pointing down).

Summarizing and Filtering
Behind the column name in the column header a summation sign and a filter sign are displayed. Select the summation sign. The following screen is opened.
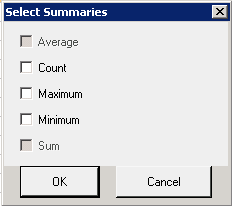
Using this screen you can calculate a number of summarizations of the column. The grey-tinted choice boxes are not available.
Meaning of the input fields:
Count |
Present a count of the number of items in the column as checked. |
Maximum |
Shows the maximum value in the column as checked. |
Minimum |
Shows the minimum value in the column as checked. |
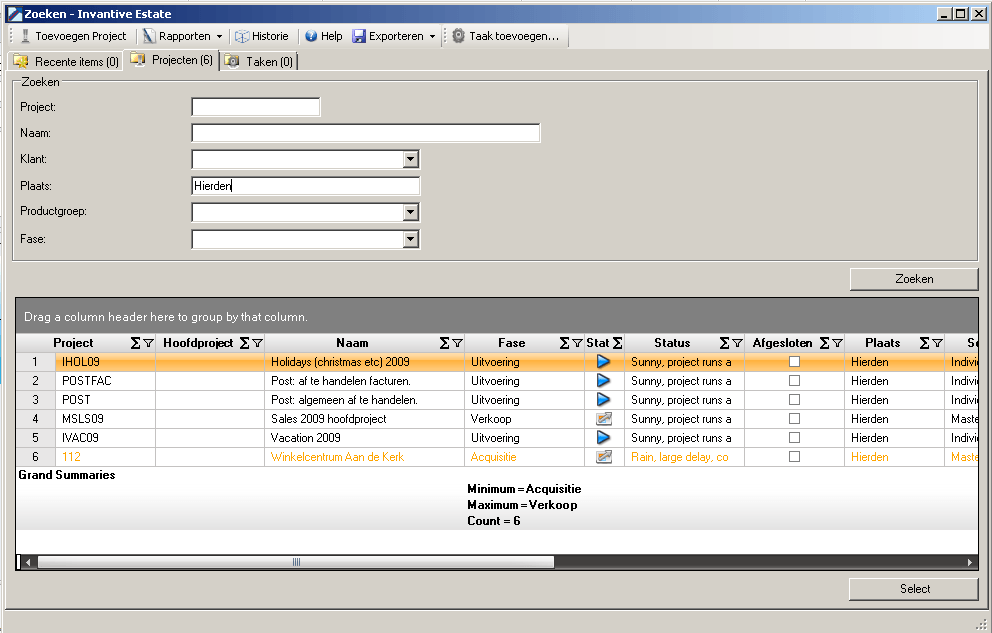
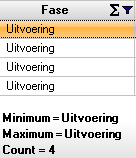
After you have made your desired choice, select OK. Under the column there will now appear the by you selected summaries. This is shown in the image below.
Using the filter sign you can filter on values in the columns. Select the filter sign in the column ‘Phase’ The following screen is opened:
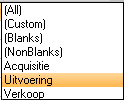
You can now select to which value you wish to filter in the column. After you have selected a value, in this case ‘Execution’, close the screen with the possible filter values. The filter sign in the column head turns blue. This allows you to see that search results are filtered on one or more values within the column. This is shown in the following image.
Moving of columns
You can easily move the columns in the search results. To do this, click the left mouse button on the column name and drag it, while you hold the mouse button to the other location. Two black arrows appear if you have dragged the column to a valid location.

The above figure shows that the column 'Project' is moved to the location between the columns ‘Holder’ and ‘Reported By’.
If you release the left mouse button, the column is moved to the new location. This is shown on the image below.

Grouping
Above the column headers of the search results the text ‘Drag a column header here to group by that column’ is displayed. You can group by dragging the column on which you want to group to this area. For example, to display the search results grouped by project, drag the column header 'Project' to the dark gray area. This is shown in the image below.

Change Column Width
Columns can be made wider or narrower by moving the cursor in a column header over the border with another column header. The cursor changes in that moment in a horizontal double arrow. Now select the left mouse button. The boundary line between the column is now displayed in bold.

This indicates that you can make the column wider or smaller by moving the mouse. In the image below the width of the column ‘Holder’ is increased.

 Invantive Estate