With PL/SQLprofiling measurements can be executed on the runtime of PL/SQL-code. In the screen Settingsyou can turn on PL/SQL profiling for all PL/SQL calls from screens and background jobs.
Steps:
•Enable profiling via ‘Setting’.
•Profiling takes a lot of I/O bandwidth. Thus, if possible you must first turn off the background schedulers.
•In site.properties use the user ‘bubs’ instead of ‘bubs_tomcat’ because of rights:
bubs_tomcat.user=bubs
bubs_tomcat.password=bubs
•Be careful: this allows the application complete access to Invantive Vision, not just through allowed
•!
•Restart Tomcat (‘/etc/init.d/bubs3 restart’ or ‘net stop “Apache Tomcat”, net start “Apache Tomcat"’).
You can request the results via:
select r.runid
, u.unit_type
, u.unit_name
, d.line#
, d.total_occur
, d.total_time/1e9 total_time_ms
, s.text
from plsql_profiler_runs r
join plsql_profiler_units u
on r.runid = u.runid
join plsql_profiler_data d
on u.unit_number = d.unit_number
and u.runid = d.runid
/* Optioneel */
join user_source s
on s.line = d.line#
and s.name = u.unit_name
and s.type = u.unit_type
where r.runid = :runid
and d.total_time/1e9 > 1/100 /* Meer dan 1/100 seconde. */
order
by d.total_time desc
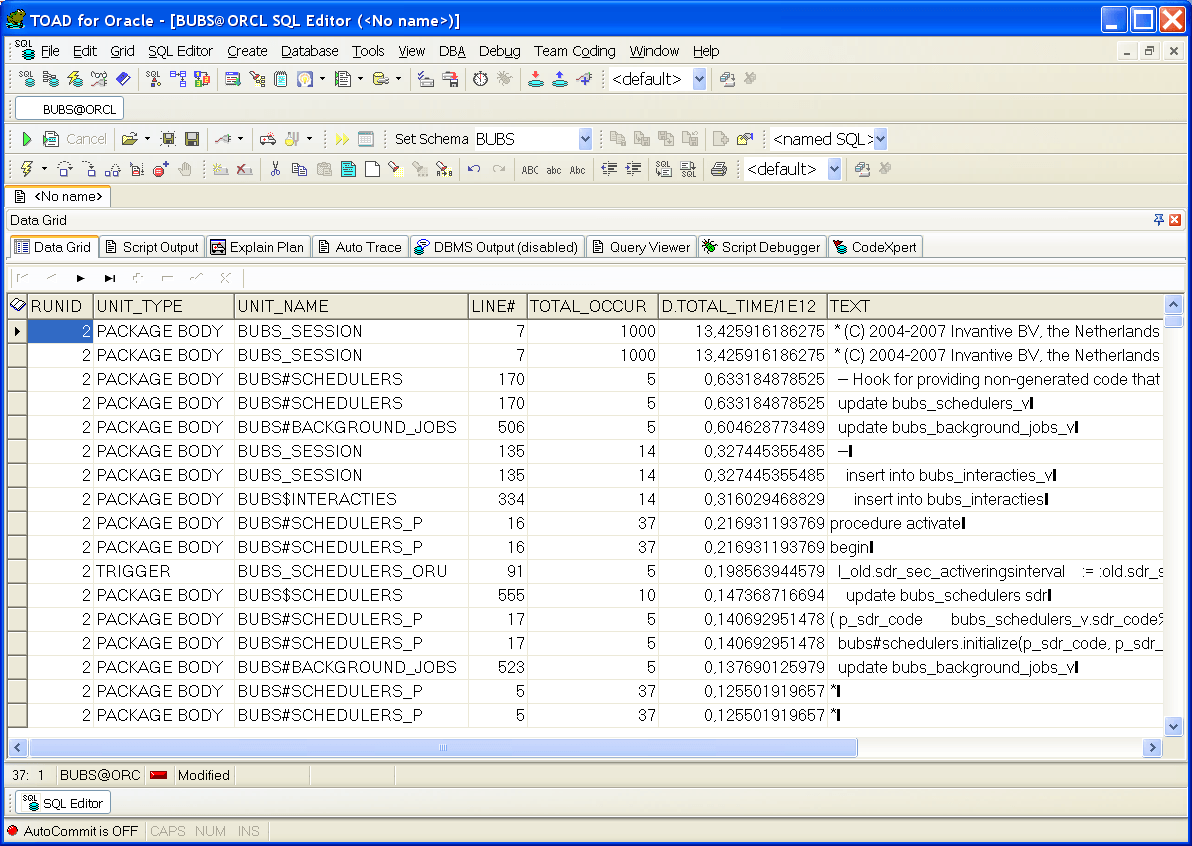
The output looks as follows:

It is also possible to profile PL/SQL procedures manually, with:
declare
l varchar2(2000);
begin
dbms_profiler.start_profiler();
dbms_output.put_line('s=' || to_char(sysdate, 'hh24miss'));
for i in 1..1000 loop
select cig_omschrijving
into l
from bubs_mijn_rechten_r
;
end loop;
dbms_output.put_line(to_char(sysdate, 'hh24miss'));
dbms_profiler.stop_profiler();
end;
 Invantive Vision